INGU Pipeline Viewer
Every inspection on a map, a tally, and a profile, in one place
An inspection report answers the question once and then goes into a folder. A distance in a table is not a location on the ground, a feature list says nothing about the pressure at that point, and comparing this year over last year means opening two documents side by side and hoping the numbering matches.
The INGU Pipeline Viewer is where inspection results are delivered instead. Every feature sits on satellite imagery where it was found, next to the tally that lists it, and the pressure profile that explains it. It runs in a browser with nothing to install, and it stays available between inspections rather than only at the moment the report lands.
Your inspections on one map
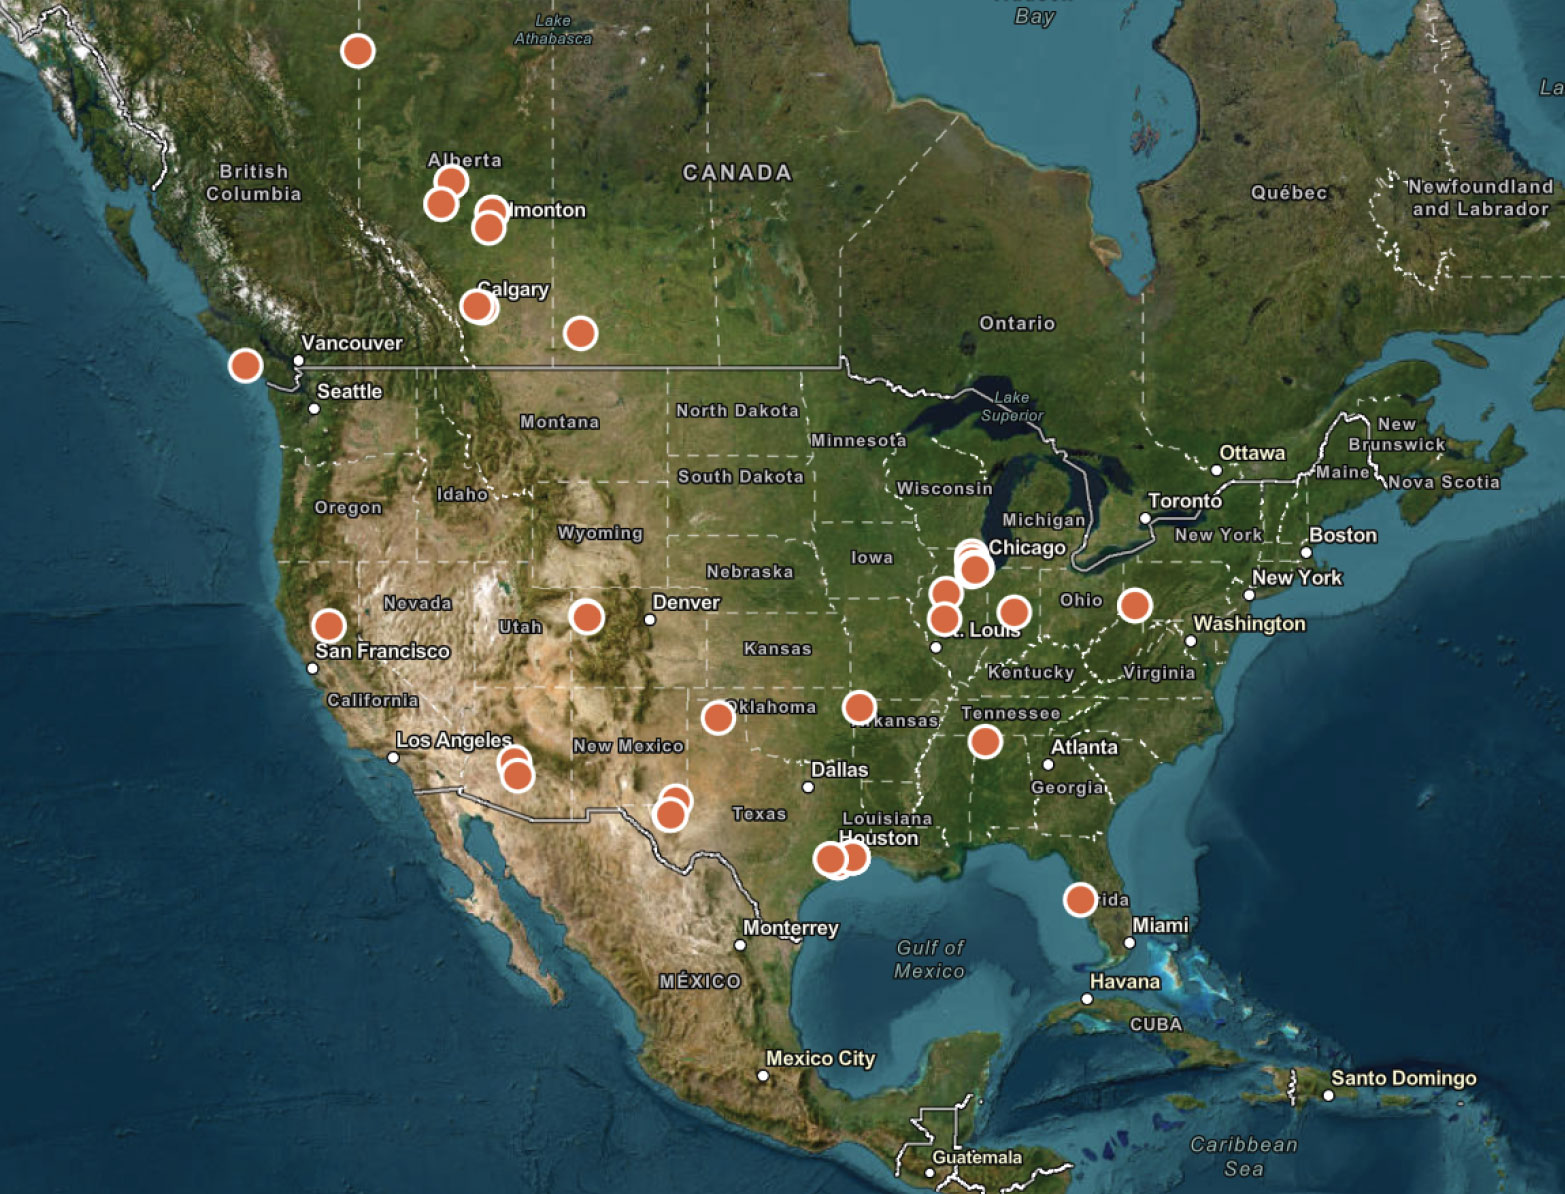
The Pipeline Viewer opens on every inspection INGU has delivered for you, plotted on a single map and listed beside it. Search by client, pipeline, or report number and open any one of them. An operator with lines across several regions sees the whole program in one view rather than a folder of separate reports.
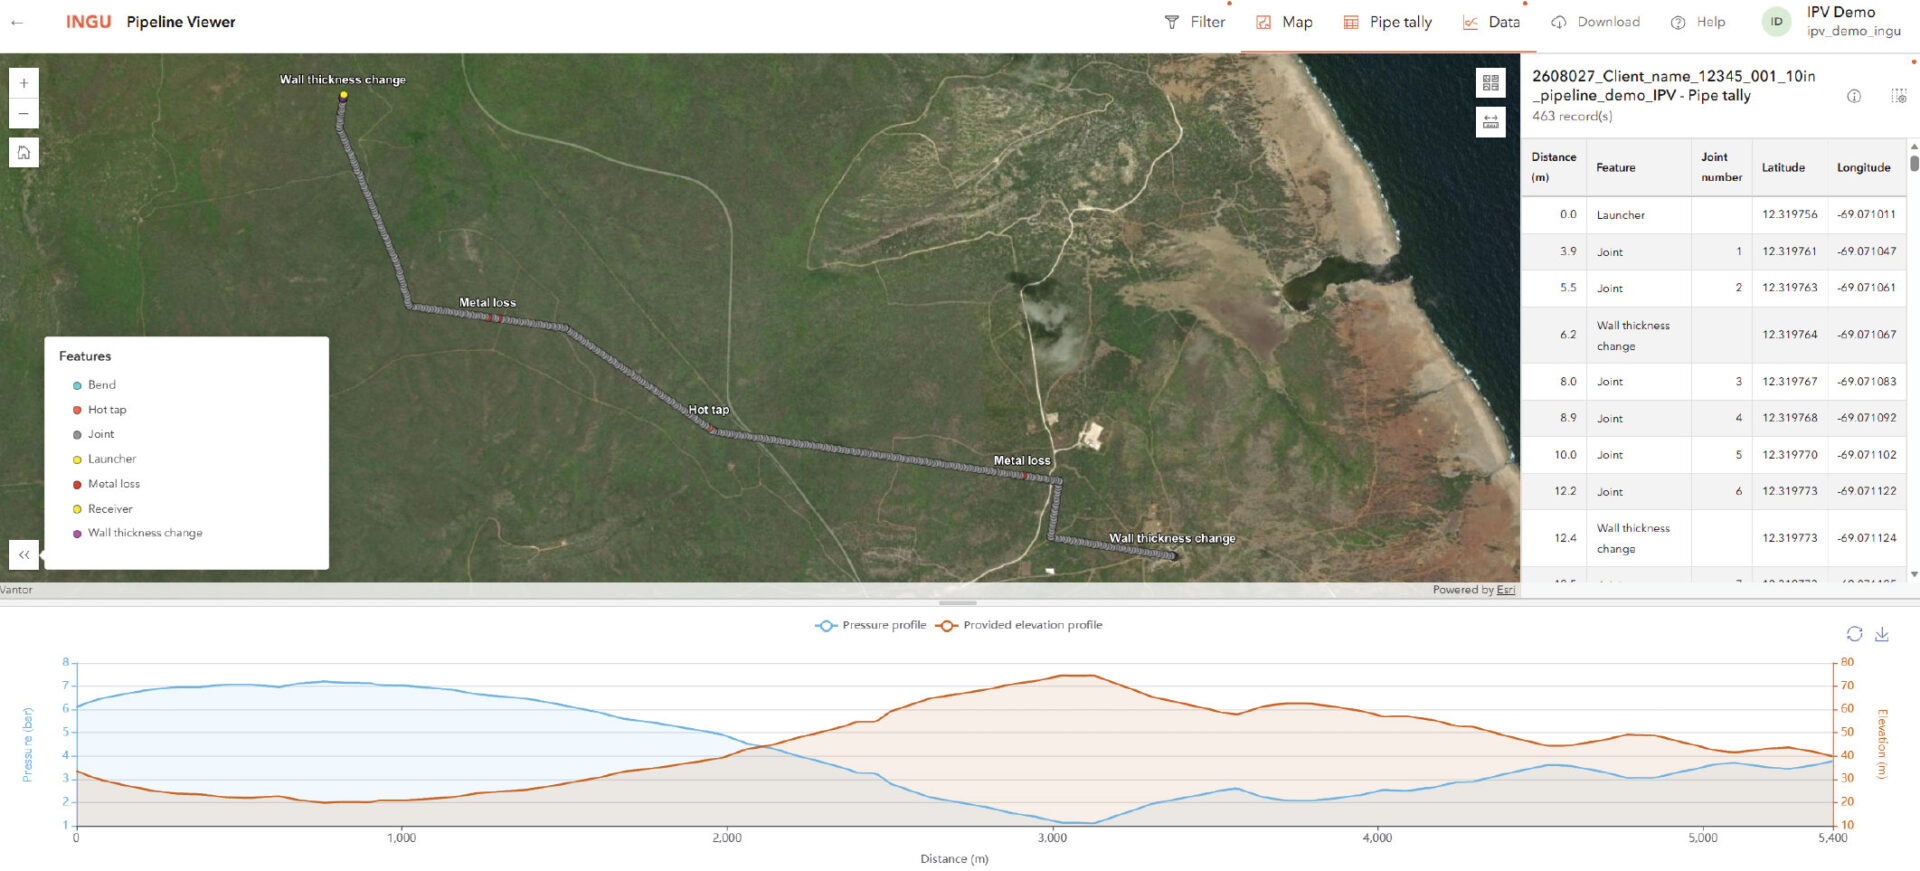
Each inspection shows the pipeline path on satellite imagery with every reported feature located along it: leaks, joints**, metal loss**, and the launcher and receiver. Click a feature for its details, filter the map down to the feature types that matter, switch basemaps, and measure distances directly on the map.
** In case of ferromagnetic pipelines
The tally lists every feature by in-pipe distance and joint number. Select a row and the map zooms to it. Choose which columns to show, select a set of features to work through, and export the tally to Excel.
Pressure and elevation
The chart plots the pressure Pipers® recorded along the pipeline against the elevation profile you provided, across the full inspection distance. Reading the two together separates the pressure change that elevation accounts for from the change that does not, which is how segments with increased friction are identified. The chart is linked to the map, so a feature in the tally can be read against the pressure at that point.
In the Pipeline Viewer you can
- Zoom, pan, and measure on satellite imagery, and switch basemaps
- Filter by feature type, and show or hide tally columns
- Click any feature for its details, on the map or in the tally
- Read the pressure profile against your elevation profile
- Select features and clear the selection as you work through them
- Download the pipe tally and the inspection results
Access
The Pipeline Viewer runs in a browser, with no installation and no GIS licence of your own. Access is per user and per pipeline, so the people who need the results have them: integrity engineering, operations, and the contractors doing the digging all work from the same map. For access, pricing, or to add users, contact ipv@ingu.com.